- Research
- Open access
- Published:
Is he or she the main player in table tennis mixed doubles?
BMC Sports Science, Medicine and Rehabilitation volume 15, Article number: 3 (2023)
Abstract
Background
Since mixed doubles have been set up in the table tennis competition of the 2020 Tokyo Olympic Games, coaches and players have paid increasing attention to mixed doubles matches. This study aims to compare and analyse male and female performance in the different contexts of table tennis mixed doubles as well as the impact of their performance on the probability of winning matches.
Methods
100 matches between the top 30 mixed doubles were selected (based on the world rankings for 2019 to 2021) as samples. According to the stroke order of a mixed doubles match, the players are divided into four groups: male versus male (Pm–m), male versus female (Pm–f), female versus male (Pf–m) and female versus female (Pf–f). Then, new methods with concepts are proposed to analyse stroke performance by four groups of players in various competition contexts of mixed doubles.
Results
(1) The stroke performance in the first four strokes was much better than that in the after four strokes (P < 0.05), and males performed better than female players in the first four strokes (P < 0.05). (2) The stroke performance of each group for winning matches was significantly better than that for losing matches (P < 0.01). (3) Players in each group performed better (P < 0.01) in the ahead and under control states than in the behind and lost control states. However, most stroke performance within the four groups was not significantly different in different states. (4) The impact of scoring rates by different groups on the winning probability of a mixed doubles match from high to low was Pm–f > Pf–f > Pm–m > Pf–m. (5) In the actual competition, the percentage of female players serving first in each game is 79.64%, and the percentage of the stroke group of female players serving to female players receiving (Pf–f) is 58.25%.
Conclusion
This study considers several competition contexts to analyse the performance of male and female players in table tennis mixed doubles. We propose that the stroke performance of male versus female players is the most important factor affecting the results of mixed doubles matches. In addition, selecting the first server or first receiver in each game reasonably and analysing the stroke orders emphatically are also very important in mixed doubles.
Background
Table tennis is a dynamic and interactive sport, and the performance of each player is influenced by that of the other player. The results of table tennis matches are affected by the performance of both players [1,2,3,4]. Doubles matches in table tennis involve two players on each pair in mixed, men’s and women’s doubles. Each player must not only cooperate with her or his partner but also pay attention to the stroke order of the opponents. Since the Rio Olympics, the International Table Tennis Federation (ITTF) and World Table Tennis (WTT) have set up mixed doubles sub events in many tournaments, making such sub events more important and influential. Therefore, table tennis associations, coaches and players in various countries have also continuously increased their investment in scientific research on mixed doubles in recent years and have achieved great success. For example, a Japanese pair won the first Olympic gold medal in the Tokyo Olympics; a Chinese pair won the gold medal of the World Table Tennis Championships in 2021; and pairs from Chinese Taipei, Chinese Hong Kong, Germany and France have also achieved excellent results in this sub event.
Most of the methods used in previous studies extend the “three-phase evaluation method” [5] from single to (mixed) doubles matches [6]. The basic principle and analysis process are the same; the two players from both sides are regarded as a whole, and the points gained and lost with each stroke are counted in turn and classified into three phases for analysis [7,8,9]. Then, the paradigm of the analyses is unified further. Some studies divided players’ scores and losses into serving and receiving rounds and built doubles technical and tactical models for analysis [10, 11]. This method can provide a good evaluation of the performance of players on both sides, but the only drawback is that opponents are still considered as a whole. Xiao et al. expanded the four serving and receiving rounds of both sides to eight (by dividing opponents into two players), improving the previous method, and the authors analysed a men’s doubles match [12].
Table tennis matches have obvious game temporal structure characteristics [13]. A game shall be won by the player or pair first scoring 11 points unless both players or pairs score 10 points when the game shall be won by the first player or pair subsequently gaining a lead of 2 points [14]. The accumulation and change of scores will cause fluctuations in players’ psychology, affecting stroke performance [15]. Therefore, players may have varying performances in different competition contexts, such as in different game stages and score states in each game. Almost all studies divided the game stages into three: start, middle and end game, but the specific classification boundaries are different. In the previous studies, 4 and 8 points had been made in a game, called the middle and end stages, respectively [15], and 1–4 points, after 9 points regarded as the beginning and crucial [16], and scores of 0–4, 5–8 and above 9 mark the start, middle and end stages, respectively [17], and more specifically, the start stage as occurring before a player scores 4 points, the middle stage as occurring when a player scores 4 points and the end stage as occurring after a player scores 8 points [18]. However, the division of score states has not been provided in table tennis academic research.
Mixed doubles differ from singles and men’s (women’s) doubles because players of different genders strike the ball alternately. Although the traditional three-phase evaluation method can reflect the overall strength of players in matches, it cannot show the performance characteristics and differences of male or female players in different competition contexts. In addition, to the best of our knowledge, no studies have focused on the performance of male and female players in mixed doubles.
Therefore, this study aims to analyse the stroke performance of players in mixed doubles and proposes the following hypotheses: (a) male and female players perform differently in different contexts; (b) the impact of their performance on winning probability is different.
Methods
Match samples
This study selected 100 matches between the top 30 mixed doubles rankings (based on the world rankings of 2019 to 2021). There were 33 pairs involved, including 18 pairs ranked 1–10, 8 pairs ranked 11–20, and 7 pairs ranked 21–30. Both pairs were analysed in each match [data taken from the ITTF (https://www.ittf.com/rankings/) and WTT (https://worldtabletennis.com/rankings). The information about the 100 matches is shown in Table 1. In addition, 14,130 points (scores and losses) from all mixed doubles pairs were analysed as raw data.
All match videos were taken from television relays or the internet. The local institutional ethics committee approved the study.
Performance indicators and data collection
Classification of striking groups in mixed doubles
According to the order of play in table tennis doubles, the server shall do service, and the receiver shall then make a receive, the partner of the server shall then make a return, and the partner of the receiver shall then make a return. After that, each player in turn in that sequence shall make a return [14]. At the end of a rally, there are only two results, namely, score or loss [19].
Therefore, in mixed doubles, the results of matches can be summarized as the strokes performance of players in four groups (Table 2), which include male versus male, male versus female, female versus male and female versus female groups. Dividing players into four groups and analysing strokes can help verify whether there are differences in performance between males and females in mixed doubles.
Data collection system
A table tennis data collection system was used for stroke information collection in this study [20,21,22]. The objectivity of the observation indicators was confirmed through the agreement of two independent observers using Cohen’s kappa statistics (inter-rater agreement) [23]. Five matches were selected from the examined games for this purpose. Cohen’s kappa values (k) of the observation indicators were found to be valued at k = 1 for the “strike number” and for “scoring or losing”.
The models of score states and game stages
A scoring system of “points–games–match” was adopted in a table tennis match, and different matches often contain different numbers of games, such as the best of 7 or 5 games. In this study, two pairs (each pair has a male player and a female player) play against each other, namely, PA and PB in mixed doubles. For game g, we denote the rally scores of pairs PA and PB as RS′A (g) and RS′B (g), respectively. We denote \({\text{RS}}_{{\text{A}}}^{\prime } \left( {\text{g}} \right) + {\text{RS}}_{{\text{B}}}^{\prime } \left( {\text{g}} \right)\) as \({\text{RS}}_{{{\text{Sum}}}}^{\prime } \left( {\text{g}} \right)\) and \(\left| {{\text{RS}}_{{\text{A}}}^{\prime } \left( {\text{g}} \right) - {\text{RS}}_{{\text{B}}}^{\prime } \left( {\text{g}} \right)} \right|\) as \({\text{RS}}_{{{\text{Dif}}}}^{\prime } \left( {\text{g}} \right)\).
There are many combinations of rally scores in a game of table tennis matches. In this study, we define 6 score states: normal glued, key glued, ahead, behind, under control and lost control in each game for the following reasons: (a) in table tennis, each rally starts with a serve (2 serves alternating between each player, and 1 serve when the score reaches 10–10), and the opponent receives until scored by one of them [24] and (b) the scores that occur closer to the end of the game have more significant impacts on the game’s outcome [25]. (c) A gap of 3–4 points only needs to win one serving and receiving turn by the player, while a difference of more than 5 points needs several serving and receiving turns, which is very difficult.
The six score states S (s) are as follows:
The attribution of rally scores in different score states is shown in Fig. 1.

The attribution of rally scores in normal/key glued, ahead/behind and under/lost control states. Note: The key glued state in green also includes scores above 11, which are not shown in Fig. 1 for simplicity, such as 11:12, 16:16, and 20:19
According to previous studies on the classification of game stages [15,16,17,18], we define three-game stages: start, middle and end.
The game stages G (s) are as follows:
The attribution of rally scores in different game stages is shown in Fig. 2.

The attribution of rally scores in the start, middle and end game stages. Note: In the end game stage, it also includes the scores after 11 on both sides, such as 11:12, 16:16 and 20:19
Computation of the scoring rate (SR), the losing rate (LR) and stroke effectiveness (SE)
We adopt a concept and algorithm for calculating the stroke scoring rate and losing rate and effectively analysed the stroke performance of players in single matches [26]. In mixed doubles matches, four players strike the ball in sequence alternately, which means that each player’s second strike comes after the other three players’ strokes. Sometimes, a certain rally result has little or nothing to do with a player’s stroke. Therefore, to better analyse the performance of each player, the method based on the number of strokes is the most suitable for mixed double matches.
Let si be the rally number of the ith strokes scored, let li be the rally number of the ith strokes lost, let Ni be the rally number of the ith strokes, let SRi (Eq. 1) be the scoring rate of the ith strokes, let LRi (Eq. 2) be the losing rate of the ith strokes, and let SEi (Eq. 3) be the effectiveness of the ith strokes. SR, LR and SE are computed by the following Eq.
The scoring rate (SR), losing rate (LR) and stroke effectiveness (SE) is defined as follows [26]: The scoring rate (SR) represents how good the scoring strikes are at the ith strokes. The losing rate (LR) represents the poor stability or receiving strikes at the ith strokes. The LR will be low if a player has good defensive strikes or stability. Stroke effectiveness (SE) represents the scoring or losing tendency at the ith stroke. Even if a player has good offensive strikes and a high SR value, the value of SE can be low when the player’s stroke is liable to fail, and LR has a high value. SE can be regarded as the contribution of the ith strokes to winning a match.
Regression and path analysis of scoring rate and win probabilities
In table tennis mixed doubles, the stroke scoring rate of male and female players facing opponents of different genders has an impact on the outcome of matches. Therefore, this study determines the influence of each group’s scoring rate on the probability of winning matches through regression equations. On this basis, a path analysis model of table tennis mixed doubles is constructed to reveal the direct and indirect effects of the scoring rate for the four groups.
Statistical analysis
All statistical tests were performed using SPSS version 24.0 software (SPSS Inc., Chicago, IL, USA) for Windows, and statistical significance was established at P < 0.05. The effect size of the T-test was estimated by Cohen’s d [27], interpreted as small (0.20), medium (0.50) or large (0.80), and the effect size of the F-test was estimated by squared association indices [28], interpreted as small (0.04), medium (0.25) or large (0.64).
Results
This chapter introduces the SR, LR and SE of strokes of the four groups (Pm–m, Pm–f, Pf–m and Pf–f) in several respects.
Stroke features in the first four strokes and after four strokes
Table 3 shows that the SR and SE of each group for the first four strokes were larger than that of after four strokes, and the LR of each group for the first four strokes was smaller than that of after four strokes, and their differences are significant [except for the SR of group Pf–m (P = 0.043), all other P values < 0.01]. This reveals that in a mixed doubles match, the impact of the first four strokes on the result of the match is significantly greater than that of after four strokes.
Figure 3 compares the SR, LR and SE values of the four groups for the first four strokes and after four strokes. In the first four strokes (Fig. 3a), the SR and SE of groups Pm–m and Pm–f were significantly higher than those of groups Pf–m and Pf–f. In contrast, the LR of groups Pm–m and Pm–f were lower than those of groups Pf–m and Pf–f, but only the difference between groups Pm–m and Pf–m was significant (P < 0.05). However, in the after four strokes, there was no significant difference among the four groups (Fig. 3b). The results show that in the first four strokes of mixed doubles, male players have higher SR and SE values and lower LR values than female players.
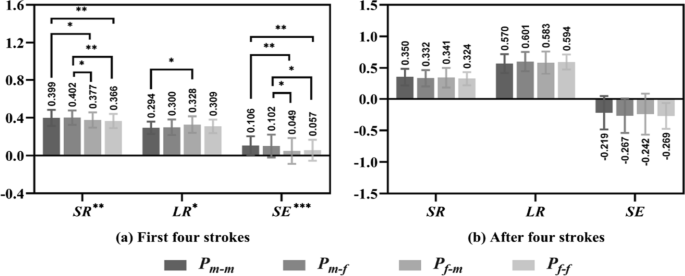
SR, LR and SE of the four groups in the first four strokes and after four strokes
Comparison of stroke features across different match results
Table 4 shows that the SR and SE of each group for winning matches were larger than those for losing matches, the LR of each group for winning matches was smaller than that for losing matches, and their differences were significant (all P < 0.01). It is worth noting that the SE of each group among the losing matches was negative.
Figure 4 compares the SR, LR and SE values of the four groups for the winning and losing matches. For the winning matches (Fig. 4a), group Pm–f had the highest SR (0.489) and SE (0.197) values and the lowest LR (0.292) value. Group Pf–f had the highest LR (0.323) value and lowest SR (0.426) and SE (0.104) values. The SR and SE of group Pm–f were significantly greater than those of groups Pf–m and Pf–f (Pm–f versus Pf–m: both P < 0.05; Pm–f versus Pf–f: both P < 0.01), and the SR of group Pm–m was significantly higher than that of group Pf–f (P < 0.05). However, no significant difference was found in LR values among the four groups. The results suggest that the SR and SE of group Pm–f play an important role in mixed doubles.
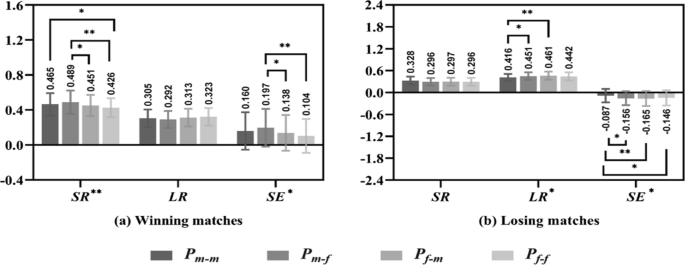
SR, LR and SE of four groups among winning and losing matches
In the lost matches (Fig. 4b), the LR of group Pm–m was significantly lower than that of groups Pm–f and Pf–m (P < 0.05 and P < 0.01, respectively). In addition, there were significant differences in SE values between groups Pm–m and Pm–f, Pf–m, Pf–f (P < 0.05, P < 0.01 and P < 0.05, respectively). However, there was no significant difference in SR values among the four groups.
Comparison of stroke features under different score states
There is only one result in each rally of table tennis matches in which one side wins or loses a point (the other side wins), and each point contributes or is lost to the match’s outcome to different degrees. Therefore, it can help coaches to find the performance differences between players clearly and intuitively by comparing the performance of players under the same score differences, even the same score differences between the end of a game and other moments.
The normal and key glued states
Table 5 shows the SR, LR and SE of each group for the normal and key glued states. The comparison of the two states shows that only group Pf–m had significant differences in SR and SE values (both P < 0.05), and the SR and SE of group Pf–m in the normal glued state were greater than those in the key glued state.
The performance of the four groups in the two states is shown in Fig. 5. In the normal glued states (Fig. 5a), groups Pm–m and Pm–f had relatively high SR (0.391 and 0.390, respectively) and SE (0.027 and 0.021, respectively). However, both the Pf–m and Pf–f groups had negative SE values of − 0.020 and − 0.026, respectively. Among them, there were significant differences in SR and SE values between groups Pm–m and Pf–f (P < 0.01, P < 0.05), and there was a significant difference in SR values between groups Pm–f and Pf–f (P < 0.05).
In the key glued states (Fig. 5b), group Pm–f shows the highest SR (0.434) and SE (0.071) values, and group Pf–m presents the lowest SR (0.315) and SE (− 0.132) values. There were significant differences between group Pm–f and group Pf–m (both P < 0.01). Group Pm–m presented greater SR (0.394) and SE (0.012) values and was significantly different from group Pf–m (both P < 0.05).
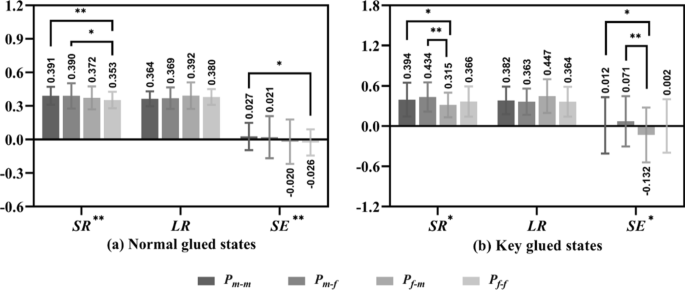
SR, LR and SE of the four groups in the normal and key glued states
The ahead, behind, under control and lost control states
Tables 6 and 7 show the performance of each group in the ahead and behind states and for the under and lost control states, respectively. Among them, the SR, LR and SE of each group show significant differences between the ahead and behind states as well as between under and lost control states (all P < 0.01). Differences between the four groups were analysed under each state, as shown in Fig. 6. In the ahead state (Fig. 6a), group Pm–f performed best on SR (0.611), LR (0.217) and SE (0.395) values, and group Pf–m performed worst on SR and SE values, which reached 0.582 and 0.354, respectively. For the behind states (Fig. 6b), each group played poorly, all SR and SE were lower than 0.3 and − 0.2, respectively, and all LR were higher than 0.5.
For the under control states (Fig. 6c), male players playing against female players always had relative advantages over other groups; for example, the SR and SE of group Pm–f were 0.736 and 0.596, respectively, and the LR (0.140) was the lowest. For the lost control states (Fig. 6d), the performance of each group was worse than that of the behind states; all SR were lower than 0.2, LR were higher than 0.6 and SE were lower than 0.4. However, there was no significant difference between the four groups (P > 0.05) in the ahead, behind, under control or lost control states.
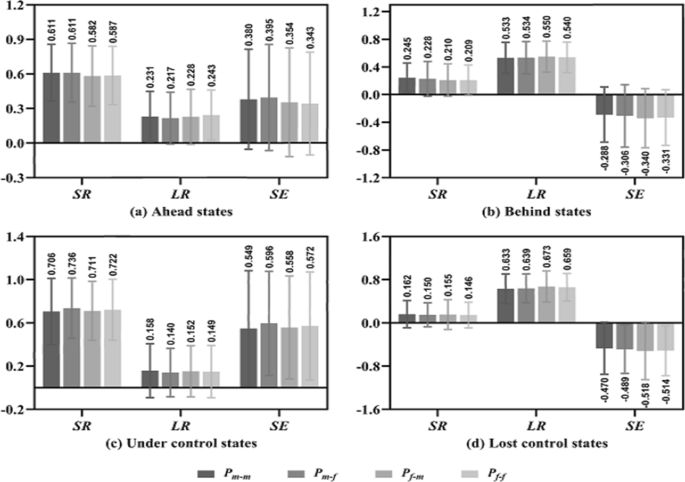
SR, LR and SE of four groups for the ahead, behind, under control and lost control states
Comparison of stroke features in different game stages
Table 8 shows each group’s SR, LR and SE for the start, middle and end stages. There was no significant difference (P > 0.05) in the SR values of each group between the three-game stages or in the LR and SE values. However, the SR and SE of each group in the end stage were higher than those in the start and middle stages (except the SR and SE of group Pm–f in the end stage were lower than those in the start stage). In addition, there was no significant difference (P > 0.05) between the four groups across the start, middle and end stages (Fig. 7)
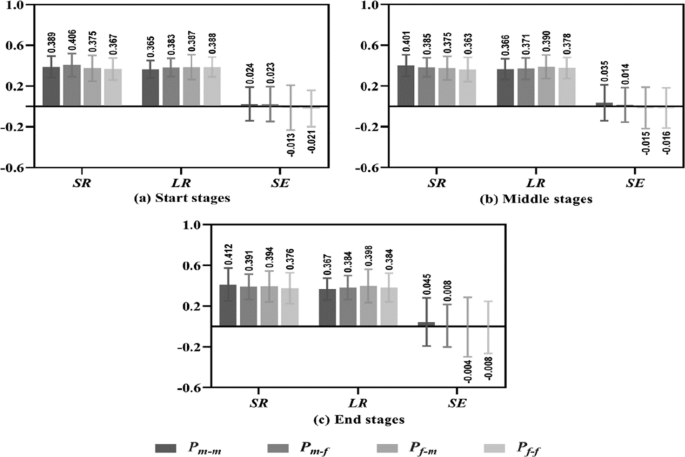
SR, LR and SE of the four groups in the start, middle and end stages
The relationship between the scoring rate and win probabilities
The multiple R, R squared and adjusted R squared of the regression model exceed 0.9, and the scoring rate of the four groups explains 91.2% of the winning probability, showing that the model presents a good fit. The variance analysis results show that the regression equation is significant (F = 506.925, P < 0.01). Table 9 shows the regression analysis results of the model coefficients. The minimum value of tolerance is 0.755, and all VIF are less than 2. Each independent variable of the equation has a significant effect on the dependent variable (P < 0.01) according to the T test. Therefore, an equation is established, and the regression model of mixed doubles is Y = 0.071 + 0.260 × 1 + 0.306 × 2 + 0.239 × 3 + 0.324 × 4. According to unstandardized coefficients, the impact of scoring rates of male and female players against opponents on the probability of winning matches is ranked from high to low: X2 (Pm–f) > X4 (Pf–f) > X1 (Pm–m) > X3 (Pf–m).
Figure 8 shows the relationships between four independent variables (groups Pm–m, Pm–f, Pf–m and Pf–f) and one dependent variable (winning probabilities of matches) in the path analysis model. There are significant correlations between the scoring rates of the four groups as well as with the winning probabilities of matches (P < 0.001). Table 10 shows the path coefficients of the mixed doubles matches. Among them, variable X2 (Pm–f) presents the largest direct path coefficient (0.404) and smallest indirect path coefficient (0.305), followed by variable X4 (Pf–f), whose direct and indirect path coefficients are 0.352 and 0.314, respectively. In contrast, variables X3 (Pf–m) and X1 (Pm–m) present larger indirect path coefficients (0.383 and 0.342) and lower direct path coefficients (0.286 and 0.308). In addition, the order of the total determined coefficient from large to small is X2 (0.286) > X4 (0.234) > X1 (0.200) > X3 (0.191), which is the same as the order of the unstandardized coefficients.
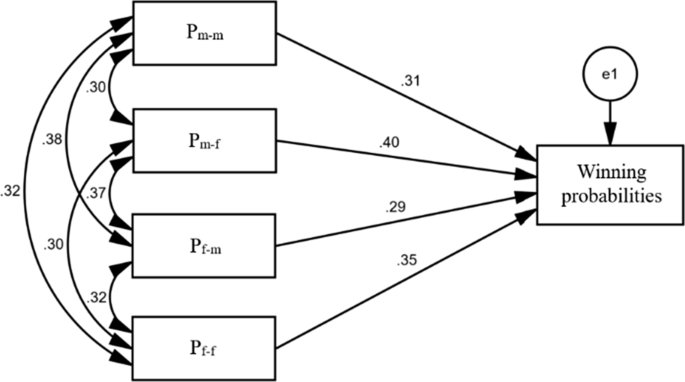
Path analysis model of table tennis mixed doubles
Discussion
This study aims to compare the stroke performance of male and female players in different contexts of table tennis mixed doubles and the impact of their performance on the outcome of matches.
The first and after four strokes, and the order of strokes
The results in Table 3 reveal that male and female players performed significantly better in the first four strokes than those in the after four strokes. Male players performed much better than female players regardless of the gender of the opponent in the first four strokes but performed similarly in the after four strokes (Fig. 3). It seems to indicate that male and female players competed more intensely for the first four strokes in mixed doubles, due to most of changes (including stroke speed, strength, rotation, etc.) occur in the first four strokes [29].
The results in Table 11 show that the percentage of serving first by female players (79.64%) was much higher than that by male players (20.36%). The percentage (58.25%) of “female serve to female receive” (Pf–f) was also higher than that of the other three groups. Before a mixed doubles match began, the referee will determine the first server and the first receiver. To avoid the formation of a stroke order in which an opponent male player strikes the ball to own female player (Pm–f), the players on one side who have the right to serve will choose to let the female player serve first. Similarly, the other side will also choose to let the female player receive first, which can prevent the opponent male player from striking the ball to the own female player in the third stroke and form an advantageous situation in which the own male player strikes the ball to the opponent female player in the fourth stroke.
Therefore, it can help coaches and players understand the importance and nature of stroke orders in mixed doubles. It can also help them focus on training in the first four strokes, especially in the round that the opponent female serves and the own female player receives.
Performance differences of players in different match results, score states and game stages
The results show that male players performed significantly better than female players on SR and SE values in the winning matches (Fig. 4a), in the normal and key glued states (Fig. 5). However, there was no difference on performance between male and female players in the LR values of winning matches, in the SR values of losing matches (Fig. 4), in the ahead, behind, under control and lost control states and in the start, middle and end stages (Figs. 6, 7).
It seems to indicate the following: (a) dividing different rally scores by score states may better reflect the performance differences of male and female players in mixed doubles than doing so according to game stages; (b) the rules of table tennis mixed doubles (where four players strike the ball in turns, which is unlike badminton and tennis doubles, where one player can strike the ball consecutively) make the process of competition fairer and the outcomes more uncertain.
Therefore, coaches and players can realize further that the key to winning mixed doubles matches may lie in cooperation, complementarity and the balancing of the strengths of male and female players on a pair rather than in the outstanding performance of one player.
The scoring rate and winning probabilities
To prove the impact of performance by male and female players on the probability of winning the game is different, this study uses the scoring rate as the performance indicator for the following reasons:
-
1.
The results of the effective equation can be positive or negative, which is equal to the difference between the scoring and losing rates. In addition, for results obtained by a quadratic calculation, where values of scoring and losing rates are in a black box, coaches and players cannot achieve the most intuitive stroke performance.
-
2.
In mixed doubles, a player with a lower losing rate may not have a higher scoring rate. For example, the losing rate of a female player against a female player (Pf-f) is not the lowest in the after four strokes, but the former’s scoring rate is lower than that of the other three groups (Table 3). In contrast, the higher the scoring rate is, the higher the probability of winning a match.
In addition, the results in Table 10 show that the SR of group Pm–f will indirectly cause the other three groups to have a positive effect on winning probabilities and is not easily affected by other groups, followed by group Pf–f. The total determined coefficient is the product of the correlation coefficient and direct path coefficient, indicating the total influence of each independent variable on the dependent variable in various ways. Therefore, the scoring rate of male players against female players has the greatest influence on the probability of winning matches, followed by that of female players against female players.
Limitations of the proposed methods
The proposed methods do not consider the specific technical and tactical variables or other aspects to minimally justify the comparison. At the same time, it provides some information about the performance difference between male or female players when facing opponents of different genders in the same standard (score or loss) and the impact of scoring rates on winning probabilities. However, the previous study proposed that there are a large number of tactical types combined with nine stroke techniques and nine stroke placements each; for example, the tactics (stroke1→2→3) in the receiving round by male players had 999 tactical types in 225 singles matches, which are shown in Table 12 [30].
Therefore, if the specific behaviours of each stroke by four players with random stroke order need to be labelled, this method will make the data too scattered to find characteristics and differences and require many professional persons and time to collect data.
Conclusion
This study considers several competition contexts to analyse the performance of male and female players in table tennis mixed doubles. The results show that due to a rule requiring four players take turns striking the ball, there is no significant difference in stroke performance between male and female players in most competition contexts (e.g., in the after four strokes; in the ahead, behind, under control or lost control states; and in the start, middle or end stages). However, this study also shows that male players perform significantly better than female players in certain cases (e.g., within the first four strokes, in winning and losing matches and in the normal and key glued states), and that group male players competing against female players has the greater impact on the outcomes of mixed doubles matches. In addition, selecting the first server or first receiver in each game reasonably and analysing the stroke orders emphatically are very important in mixed doubles.
Availability and data materials
The datasets used and/or analysed during the current study are available from the corresponding author on reasonable request.
Abbreviations
- Pm-m :
-
Male player vs. male player
- Pm-f :
-
Male player vs. female player
- Pf-m :
-
Female player vs. male player
- Pf-f :
-
Female player vs. female player
- SR:
-
Scoring rate
- LR:
-
Losing rate
- SE:
-
Stroke effectiveness
- VIF:
-
Variance inflation factor
- PC:
-
Path coefficient
- TDC:
-
Total determined coefficient
References
Strauss D, Arnold B. The rating of players in racquetball tournaments. J R Stat Soc Ser C (Appl Stat). 1987;36(2):163–73. https://doi.org/10.2307/2347548.
Mcgarry T, Franks IM. A stochastic approach to predicting competition squash match-play. J Sports Sci. 1994;12(6):573–84. https://doi.org/10.1080/02640419408732208.
Hughes MD, Bartlett RM. The use of performance indicators in performance analysis. J Sports Sci. 2002;20(10):739–54. https://doi.org/10.1080/026404102320675602.
Lames M, Mcgarry T. On the search for reliable performance indicators in game sports. Int J Perform Anal Sport. 2007;7(1):62–79. https://doi.org/10.1080/24748668.2007.11868388.
Wu HQ, Wu H, Cai XL, et al. Strength evaluation and technique analysis on Chinese players in table tennis matches of the 1988 Olympic Games. China Sport Sci Technol. 1988;8:21–9. https://doi.org/10.16470/j.csst.1988.03.004.
Zhang H, Zhou Z, Yang Q. Match analysis of table tennis in China: a systematic review. J Sports Sci. 2018;36(23):2663–74. https://doi.org/10.1080/02640414.2018.1460050.
Tang JJ. Analysis of the skills of the chinese and European elite men’s doubles players in the 43rd World Table Tennis Championships. J Beijing Univ Phys Educ. 1997;20(2):85–9. https://doi.org/10.19582/j.cnki.11-3785/g8.1997.02.020.
Dong Y, Zhu FJ, Gu JP. Analysis on technique and tactics of the excellent foreign doubles in the 48th World Table Tennis Championships. J Chengdu Sport Univ. 2005;31(5):73–5. https://doi.org/10.15942/j.kcsu.2005.04.019.
Liu FD, Cai XL. Analysis of the technical development tendency of the table-tennis women’s doubles and the mixed doubles. J Beijing Sport Univ. 2006;29(8):1126–30. https://doi.org/10.19582/j.cnki.11-3785/g8.2006.08.044.
Qiao YP. On the video rapid feedback and diagnose method of techniques and tactics in table tennis. J Beijing Sport Univ. 2008;31(10):1351–6. https://doi.org/10.19582/j.cnki.11-3785/g8.2008.10.016.
Wang YQ, Zhang H. Research and application on the analysis system of techniques and tactics of table tennis match. J Beijing Sport Univ. 2009;32(2):136–8. https://doi.org/10.19582/j.cnki.11-3785/g8.2009.02.040.
Xiao DD, Qian L, Zhang XL. Construction and application of eight-round and three-stage method in table tennis doubles techniques and tactics. J Beijing Sport Univ. 2019;42(12):53–60. https://doi.org/10.19582/j.cnki.11-3785/g8.2019.12.007.
Leite JV, Barbieri FA, Miyagi W, et al. Influence of game evolution and the phase of competition on temporal game structure in high-level table tennis tournaments. J Hum Kinetics. 2017;55(1):55–63. https://doi.org/10.1515/hukin-2016-0048.
International Table Tennis Federation (ITTF). Handbook ITTF. 2022.
Ren J, Zhang H, Shi ZH, et al. Analysis of player’s mental status during table tennis competition based on variation of score. China Sport Science. 2013;33(11):94–7. https://doi.org/10.16469/j.css.2013.11.013.
Fuchs M, Liu RZ, Lanzoni ID, et al. Table tennis match analysis: a review. J Sports Sci. 2018;36(23):1–10. https://doi.org/10.1080/02640414.2018.1450073.
Chen B. Analysis of Chinese elite women table tennis players’ mental state during competitions base on the change of heart rate. Master Thesis, Shanghai University of Sport, CN. 2017.
Xiao DD, Zhou XD, Liu H, et al. The construction and application of double three-phase method on table tennis technique and tactics. J China Sport Sci Technol. 2018;54(5):112–6. https://doi.org/10.16470/j.csst.201805017.
Zhou Z, Zhang H, et al. A visible analysis approach for table tennis tactical benefit. J Sports Sci Med. 2022;21:517–27. https://doi.org/10.52082/jssm.2022.517.
Wu YC, Lan J, Shu XH, et al. Ittvis: interactive visualization of table tennis data. IEEE Trans Vis Comput Graphics. 2017;24(1):709–18. https://doi.org/10.1109/TVCG.2017.2744218.
Wang JC, Zhao KJ, Deng DZ, et al. Tac-simur: tactic-based simulative visual analytics of table tennis. IEEE Trans Vis Comput Graph. 2020;26(1):407–17. https://doi.org/10.1109/TVCG.2019.2934630.
Zhou Z, Zhang H. A Multi-dimensional analytical system of table tennis matches. In: Lames M., Danilov A., Timme E., Vassilevski Y, editors. Proceedings of the 12th international symposium on computer science in sport (IACSS 2019). IACSS 2019. Advances in Intelligent Systems and Computing, vol 1028. Springer, Cham. (pp. 45–52). https://doi.org/10.1007/978-3-030-35048-2_6.
Robson C. Real world research. 2nd ed. Oxford: Blackwell; 2002.
GM Á, García-de-Alcaráz, Furley AP. Analysis of contextual-related variables on serve and receiving performances in elite men’s and women’s table tennis players. International Journal of Performance Analysis in Sport 2017; 17(6):919–33. https://doi.org/10.1080/24748668.2017.1407208.
Liu WM, Zhou Z, Shen YW, et al. Stroke performance relevance model for elite table tennis matches. Int J Perform Anal Sport. 2022;22(4):558–70. https://doi.org/10.1080/24748668.2022.2089514.
Tamaki S, Yoshida K, Yamada K. A shot number based approach to performance analysis in table tennis. J Hum Kinetics. 2017;55(1):7–18. https://doi.org/10.1515/hukin-2017-0002.
Cohen J. A power primer. Psychol Bull. 1992;112(1):155–9. https://doi.org/10.1037/0033-2909.112.1.155.
Ferguson CJ. An effect size primer: a guide for clinicians and researchers. Prof Psychol Res Pract. 2009;40(5):532–8. https://doi.org/10.1037/a0015808.
Zhang H, Liu W, Hu JJ, et al. Evaluation of elite table tennis players’ technique effectiveness. J Sports Sci. 2013;31(14):1526–34. https://doi.org/10.1080/02640414.2013.792948.
Zhang H, Zhou Z. An analytical model of the two basic situation strategies in table tennis. Int J Perform Anal Sport. 2017;17(6):970–85. https://doi.org/10.1080/24748668.2017.1415071.
Acknowledgements
The authors would like to thank the Chinese Table Tennis Association and the Chinese Table Tennis Team for providing some of the results of this study with opportunities for application in training.
Funding
Open Access funding was enabled and organized by the Sport Big Data Team of Zhejiang University. This research received no external funding.
Author information
Authors and Affiliations
Contributions
Conceptualization, ZZ and HZ; methodology, ZZ and HZ; formal analysis, ZZ and HZ; data processing, ZZ; writing—original draft preparation, ZZ; writing—review and editing, HZ; project administration, HZ; funding acquisition, N/A. All authors have reviewed and agreed to the published version of the manuscript. All authors read and approved the final manuscript.
Corresponding author
Ethics declarations
Ethics approval
The study was approved by the ethics committee of the College of Education of Zhejiang University, and all methods were performed in accordance with the relevant guidelines and regulations.
Consent for publication
Not applicable.
Competing interests
The authors declare that they have no competing interests.
Additional information
Publisher’s Note
Springer Nature remains neutral with regard to jurisdictional claims in published maps and institutional affiliations.
Rights and permissions
Open Access This article is licensed under a Creative Commons Attribution 4.0 International License, which permits use, sharing, adaptation, distribution and reproduction in any medium or format, as long as you give appropriate credit to the original author(s) and the source, provide a link to the Creative Commons licence, and indicate if changes were made. The images or other third party material in this article are included in the article's Creative Commons licence, unless indicated otherwise in a credit line to the material. If material is not included in the article's Creative Commons licence and your intended use is not permitted by statutory regulation or exceeds the permitted use, you will need to obtain permission directly from the copyright holder. To view a copy of this licence, visit http://creativecommons.org/licenses/by/4.0/. The Creative Commons Public Domain Dedication waiver (http://creativecommons.org/publicdomain/zero/1.0/) applies to the data made available in this article, unless otherwise stated in a credit line to the data.
About this article

Cite this article
Zhou, Z., Zhang, H. Is he or she the main player in table tennis mixed doubles?. BMC Sports Sci Med Rehabil 15, 3 (2023). https://doi.org/10.1186/s13102-022-00612-0
Received:
Accepted:
Published:
DOI: https://doi.org/10.1186/s13102-022-00612-0